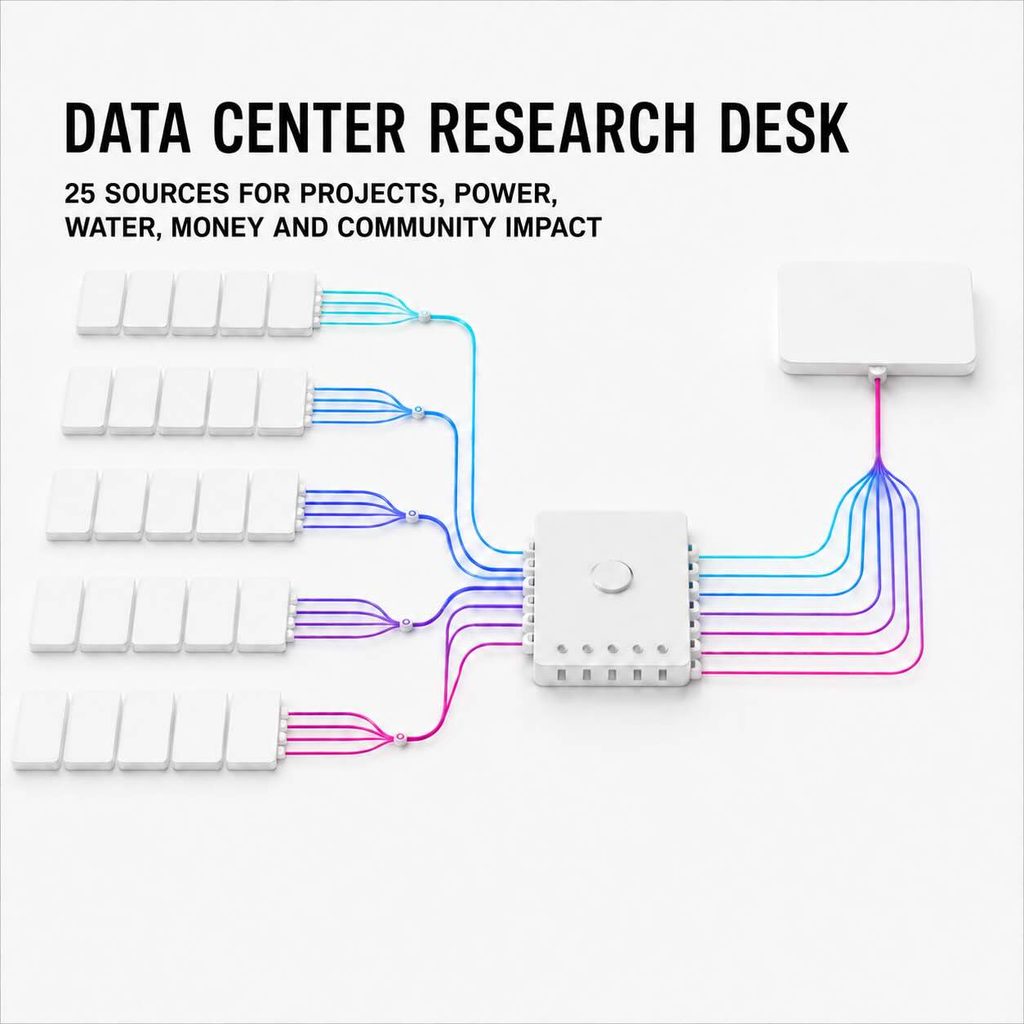
25 sources for projects, power, water, money and community impact
Data-center announcements usually arrive as finished stories. A company names the location, investment, capacity and expected benefits. The difficult questions are left for later, when the land, electricity, water, financing, permits and community response begin deciding what can actually happen.
The Data Center Research Desk brings together 25 useful sources for investigating those questions. Some help identify projects. Others reveal utility obligations, water conditions, public subsidies, company commitments, local approvals or economic outcomes.
No single source tells the whole story. Commercial databases can identify a project without proving it will be built. Government records can document an approval without proving the project is financed. Company reports can describe a commitment without showing what happened in the host community.
The value comes from knowing where to look, what each source can establish and where its authority ends.
Find a data-center project
Baxtel is one of the best places to begin looking for data-center facilities and proposed developments. It often provides the operator, location, development status and reported power capacity. Use it to discover projects and establish an initial record. Then verify important details through planning documents, utility filings and company disclosures. A project appearing in a database means someone is tracking it. It does not mean the project will be completed.
DC Byte provides commercial intelligence on data-center markets, capacity and development pipelines. Its distinction between operational, under-construction, committed, early-stage and land-bank capacity makes it especially useful when announced capacity is being mistaken for inevitable capacity. Use it to compare markets and development stages. Access is primarily paid, so it is best suited to research where market-level accuracy justifies the expense.
S&P Global 451 Research Datacenter KnowledgeBase provides extensive facility, provider, market and capacity information. It is useful for institutional research, ownership analysis and comparisons across companies or regions. Its classifications may differ from Baxtel or DC Byte, which is not necessarily a flaw. The disagreement can reveal uncertainty about a project’s status that deserves further investigation.
Data Center Map offers a free directory of data centers, operators, colocation markets and connectivity locations. It is useful for quickly understanding whether an area already has an established data-center presence. Directory listings should not be treated as a definitive count of campuses, buildings or available capacity. One campus may contain several facilities, and one listing may reveal considerably less than its confident little map pin suggests.
Cloudscene adds information about connectivity providers, cloud services and carrier presence. Use it when evaluating whether a facility sits within a mature network ecosystem or has access to multiple connectivity options. Cloudscene is more useful for understanding network context than for confirming the development status of a proposed hyperscale campus.
Test the power claim
U.S. Energy Information Administration provides official information on electricity generation, capacity, prices, sales, customers and fuel mix. Use EIA data to establish the state or regional electricity baseline before attributing every increase in demand or price to data centers. It is particularly useful for tracking changes over time. National forecasts can help explain the scale of the issue, but they should not be presented as evidence of the demand created by one proposed facility.
FERC eLibrary contains regulatory filings involving utilities, transmission, tariffs, rates and major electricity disputes. Search by utility, company, project name or docket number. Terms such as “large load,” “special contract,” “co-located load” and “data center” can uncover proceedings that explain who may pay for new infrastructure and what conditions regulators are considering. A filing proves that something was proposed, requested, disputed or approved. It does not prove the facility will operate.
NERC Reliability Assessments examine whether regions are expected to have enough electricity and transmission capacity to serve future demand reliably. Use these assessments to compare projected large-load growth with planned generation, reserve margins and known constraints. NERC regions do not follow state lines neatly. Unfortunately, the electrical grid declined to organize itself around the convenience of website researchers.
Berkeley Lab’s Electricity Markets and Policy data includes project-level information from generation and storage interconnection queues across the United States. Use it to examine whether a region expecting major data-center growth also has new generation or storage seeking grid access. Do not add every queued megawatt together and call it future supply. Many projects remain in queues for years, change size or never reach operation.
GridStatus.io makes electricity-market information from U.S. grid operators easier to monitor and compare. It can be used to follow demand, generation mix, market prices, congestion and changing grid conditions. This is especially helpful when repeatedly tracking a region rather than researching it once. Important conclusions should still be checked against the underlying grid operator or regulatory filing.
EPA eGRID provides information about electricity generation, fuel mix and emissions at the power-plant, balancing-area and subregion levels. Use the appropriate eGRID subregion when estimating the emissions associated with grid-supplied electricity. Corporate renewable-energy purchases may matter financially and contractually, but they should not automatically be treated as the physical electricity mix serving a facility every hour.
Open Infrastructure Map provides a visual layer showing mapped power plants, transmission lines, substations and telecommunications infrastructure. It is useful for early location research and for seeing how a proposed site relates to visible infrastructure corridors. The map is based largely on OpenStreetMap data. Missing infrastructure may simply be unmapped, so an empty space should not be mistaken for a definitive answer.
Investigate water and physical risk
USGS Water Data for the Nation provides real-time and historical information from monitoring locations across the country. Nearby stream, groundwater, reservoir, precipitation and water-quality records can reveal seasonal conditions and longer-term patterns. Use the data with local utility records and proposed facility requirements. The existence of water near a site does not establish that the water is legally, physically or politically available for cooling.
USGS Water-Use Data provides estimates of water use by location, category and source. It can help establish how existing demand is divided among public supply, agriculture, industry and power generation. Publication dates matter because national estimates are not real-time. Use the data as a baseline, then obtain newer local information before drawing conclusions about current capacity.
Drought.gov combines current drought conditions, historical information, forecasts and federal indicators. Use it to examine both present conditions and the frequency of past drought. A data center may operate for decades, so a wet year should not be allowed to impersonate a long-term water strategy.
FEMA’s Resilience Analysis and Planning Tool provides geographic information about natural hazards, exposure, vulnerability and community resilience. It can help screen a proposed location for flood, extreme heat, wildfire, hurricane, tornado and other risks. This is a starting point for comparison. A material risk should be investigated through specialized and local sources before it becomes a conclusion.
Follow the companies and the money
SEC EDGAR contains filings from public companies, including annual reports, quarterly reports, material-event disclosures and contract exhibits. Search for project names and terms such as “data center,” “capacity,” “lease,” “power,” “capital commitment,” “joint venture” and “customer concentration.” Comparing filings over time can reveal commitments that have grown, weakened, changed or quietly disappeared. Private developers and subsidiaries may require additional research because they are not always named clearly in the parent company’s filings.
Good Jobs First Subsidy Tracker collects information on federal, state and local business subsidies. Search the developer, operating subsidiary and ultimate parent company because the name receiving the benefit may not be the name used in the announcement. Record the government involved, subsidy type, estimated value, date and promised employment. Then retrieve the underlying agreement. Database totals may not capture uncapped exemptions or the full value of future tax losses.
USAspending.gov is the federal government’s official source for contracts, grants, loans and other awards. Search operators, utilities, contractors, universities and local governments connected to a project. Pay attention to the difference between the recipient’s headquarters and the award’s place of performance. Otherwise, a Delaware mailing address can appear to have developed an alarming amount of infrastructure.
Company sustainability reports can provide information about energy procurement, water use, emissions, efficiency and corporate commitments. Reports from companies such as Microsoft, Amazon, Google and Meta can help explain stated goals and methodologies. Treat these figures as company-reported information. Global totals should not be presented as proof of what happened at a specific facility or within its host community.
Check approvals and local decisions
Municode provides access to municipal codes and ordinances for many U.S. localities. It is a useful doorway into zoning rules, definitions, setbacks, noise limits and development requirements. Once the relevant jurisdiction is identified, move from Municode to the government’s planning portal, meeting packets, agendas, permit records and hearing videos. Local records are where an announced project may become approved, conditioned, redesigned, delayed, withdrawn or rejected.
The company named publicly may not be the applicant appearing in local records. Search the site address, landowner, parcel number, development company, operating subsidiary and project code name. Record the application date, requested zoning action, hearing schedule, approval conditions and next decision point. “Project Bluebird LLC” may sound like a minor character in a children’s book, but it may control several billion dollars of development.
Measure jobs and community outcomes
Census Bureau Data provides information about population, income, housing, commuting, education and demographics at several geographic levels. Use it to establish what the host community looked like before a project was built. County averages can conceal the experience of residents living closest to the site, so tract and community-level information may be more useful when impacts are concentrated.
BLS Quarterly Census of Employment and Wages provides county-level information about employment, establishments and wages by industry. It can help test permanent-job and wage promises against actual outcomes. Separate construction employment from long-term operations. A project can create substantial temporary work without becoming a major permanent employer. Small employment counts may be suppressed, which limits how confidently the data can be tied to one facility.
Bureau of Economic Analysis Regional Data provides state and county information on economic output, income and industry activity. Use it to examine whether a host county changed after development and how its experience compares with similar counties. An increase in county GDP after a data center opens is evidence worth investigating. It is not automatic proof that the data center caused the increase.
FCC National Broadband Map shows reported broadband availability and providers across the United States. It can help evaluate whether communities hosting digital infrastructure also receive strong household connectivity. The map does not reveal every private fiber route or prove that a location has capacity suitable for a data center. It is most useful as community and connectivity context.
How to research one project
Begin by identifying the physical site and every organization attached to it. The campus name, applicant, landowner, developer, operating subsidiary, parent company and expected customer may all be different. Keep them separate until the relationships are confirmed.
Record the project’s status with enough precision to distinguish an announcement from land control, an application, an approval, a power agreement, financing, construction or operation. Do not replace older claims when the numbers change. Preserve the original figure, the new figure, both source dates and what may explain the difference.
Test the resource case independently. Compare the requested electricity and water with the infrastructure, contracts, regulatory approvals and regional conditions needed to supply them. Separate what exists now, what has been approved, what has been proposed and what someone expects to exist later.
Test the economic promise the same way. Record subsidies, expected investment, construction jobs, permanent jobs and public-revenue claims before the project is built. Return later to compare those promises with employment, tax and economic data.
Most importantly, record what each source cannot establish. A project database does not prove financing. A permit does not prove construction. A corporate commitment does not prove local performance. A public hearing does not prove the community had meaningful power over the outcome.
Data helps. Judgment still has a job.
These sources can show where a project is proposed, what it may require, who is involved and what governments or companies have formally said. They can also reveal contradictions that disappear when every announcement is read separately.
They cannot decide whether the arrangement is fair, viable or worth its risks.
That still requires asking who benefits, who pays, who decides and who carries the risk when the plan changes.
See something we should add or correct?
The Research Desk should improve as better sources become available and existing databases change. If you know of a useful government database, local planning resource or material correction, send it to Data Center Dilemma AI.
We will review the evidence. Promotional listings dressed as public service may receive a slightly less enthusiastic reception.